Graphs can be used to represent data from tables.
Data from graphs is easier to read and interpret.
Data can be represented using the following graphs:
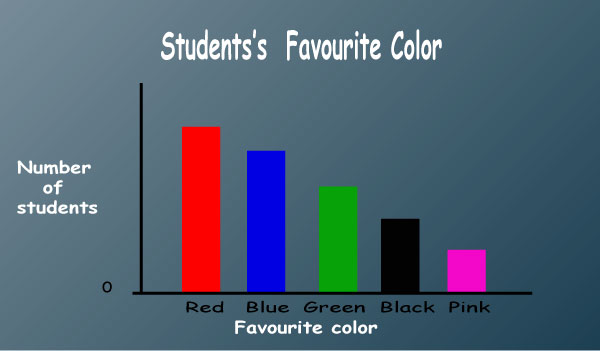
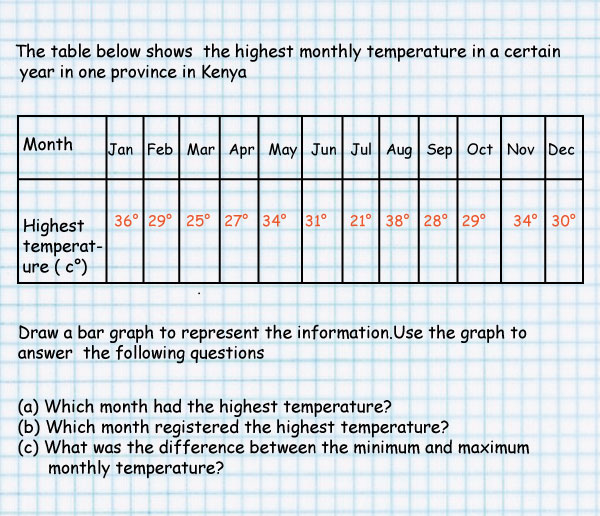
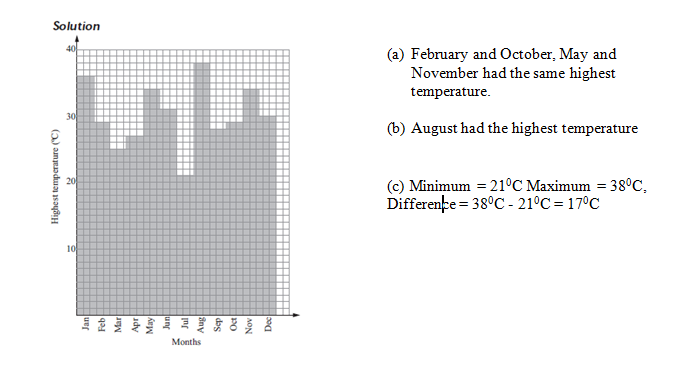
A bar graph represents the relationship between two quantities such as rainfall and month of the year. The height of the bars show the frequency.
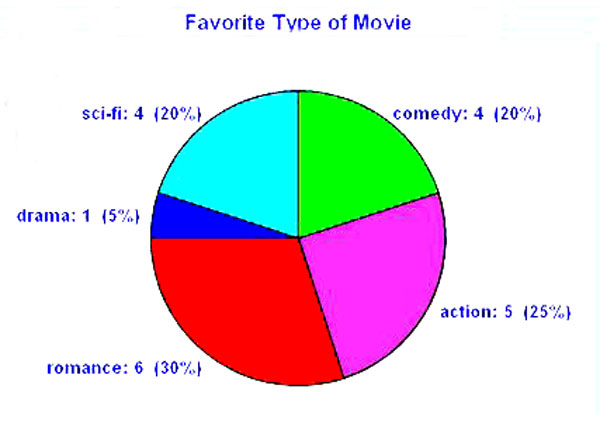
A pie chart is a graph that represent data in a circle which is divided into sectors proportional to respective quantities.
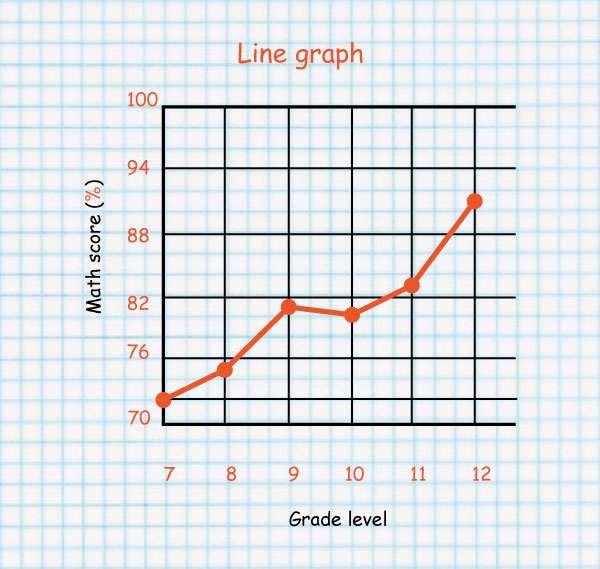
In a line graph a line is used to show the exact relationship between two quantities.
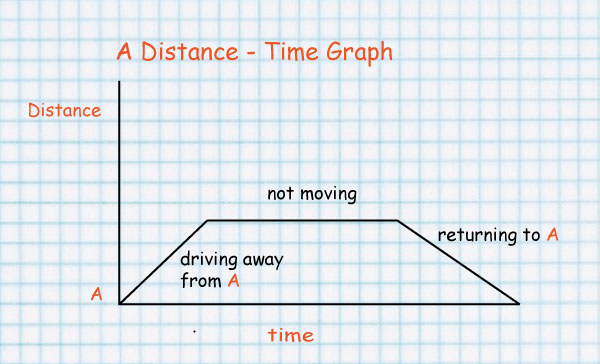
A travel graph is a line graph in which the two quantities are distance and time.
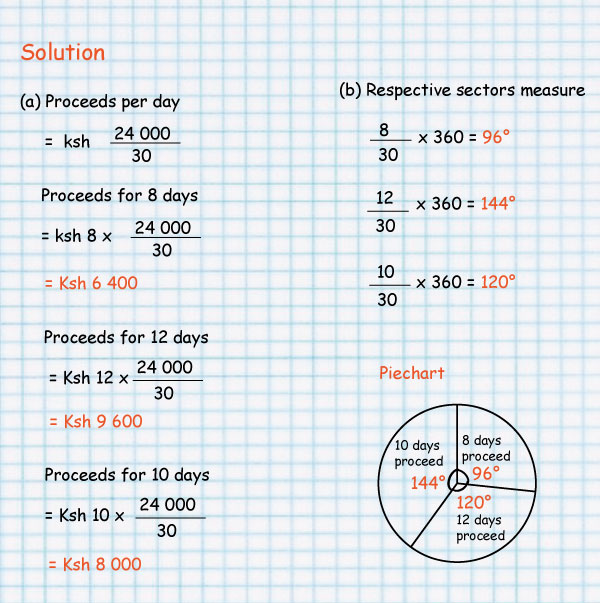
Three business partners shared proceeds amounting to Sh 24 000 according to the number of days spent in the business on a particular month of April.
Their respective days were 8, 12 and 10.
(a) How much did each get?
(b) Draw a circle graph to represent the information.
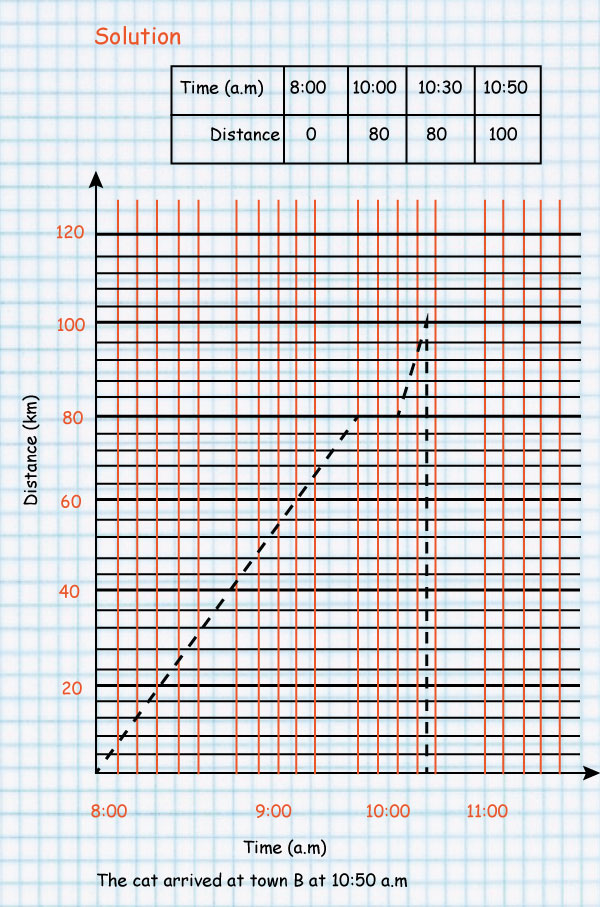
The distance between town A and B is 100 km.
A car left town A at 8.00 a.m at a speed of 40 km/h.
After 2 hours, the driver stopped to have a snack which took 30 minutes.
He continued his journey at a speed of 60 km/h.
Draw a travel graph to show the movement of the car.
Find the time the car arrived at town B.
1. Pupils counted different types of vehicles passing along the road near their school. they recorded their results in the graph below.
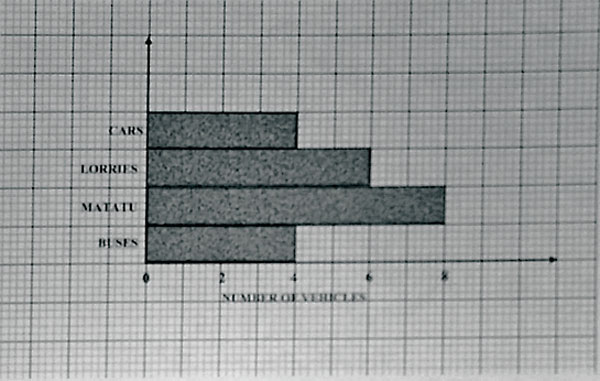
What is the total number of vehicles?
A. 22 B. 8 C. 14 D. 4
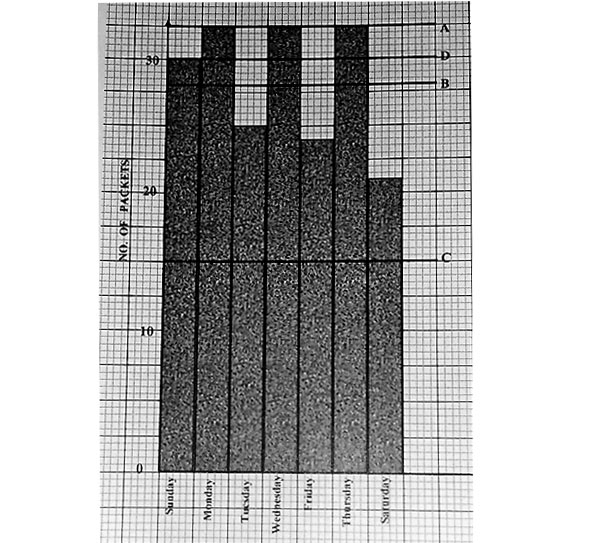
2. Matoke sod the following number of packets of milk in her kiosk in one week:
|
SUNDAY |
30 |
|
MONDAY |
32 |
|
TUESDAY |
25 |
|
WEDNESDAY |
32 |
|
THURSDAY |
24 |
|
FRIDAY |
32 |
|
SATURDAY |
21 |
Which one of the lines A, B, C and D in the bar graph below correctly shows the mean number of packets sold per day?
3. The graph below shows the number of different fruits that Nduku sold on a market day.
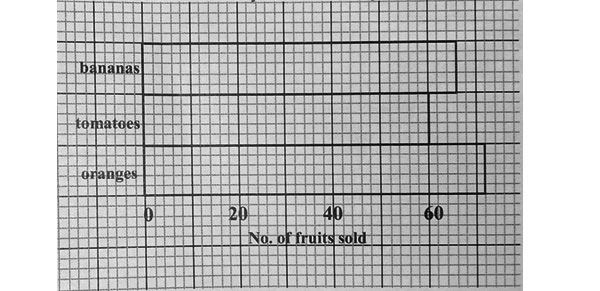
The prices of the fruits were as follows:
3 bananas for sh 2
2 tomatoes for sh 1
4 oranges for sh 1
How much money did she receive altogether?
A. Sh 92 B. Sh 128 C. Sh 198 D. Sh 147
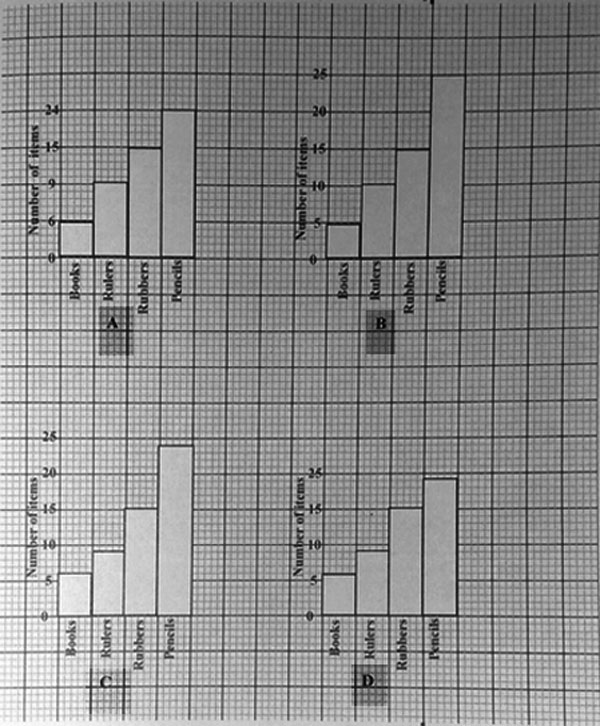
4. A shopkeeper sold 6 books, 9 rulers, 15 rubbers and 24 pencils. Which of the following bar graphs correctly represents this information?
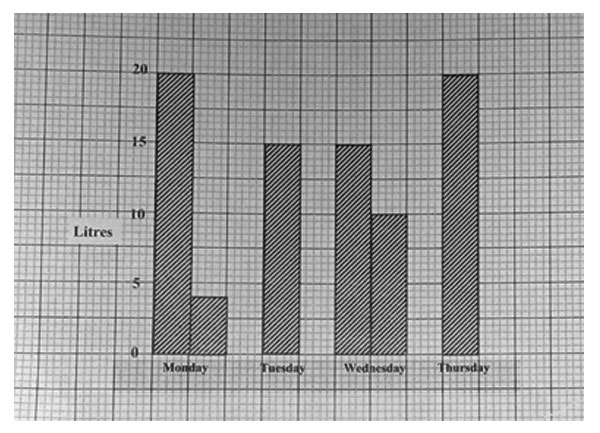
5. The bar graph below represents the amount of milk in litres produced by 3 cows. On what day was the greatest amount of milk produced?
A. Monday B. Tuesday C. Wednesday D. Thursday
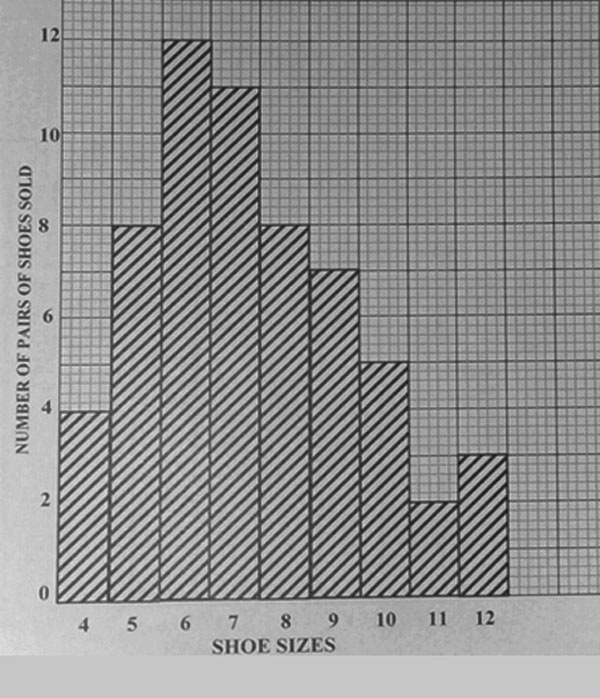
6. The graph below shows the sale of shoes in one day.
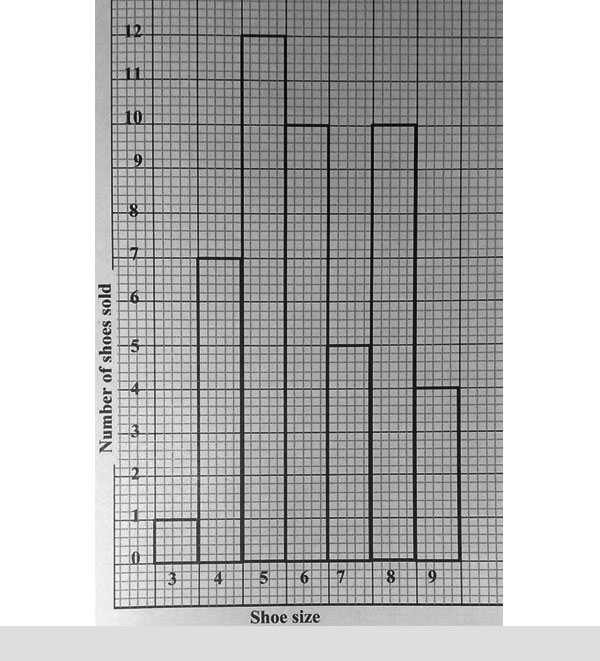
What shoe size was bought most?
A. 12 B. 5 C. 10 D. 6
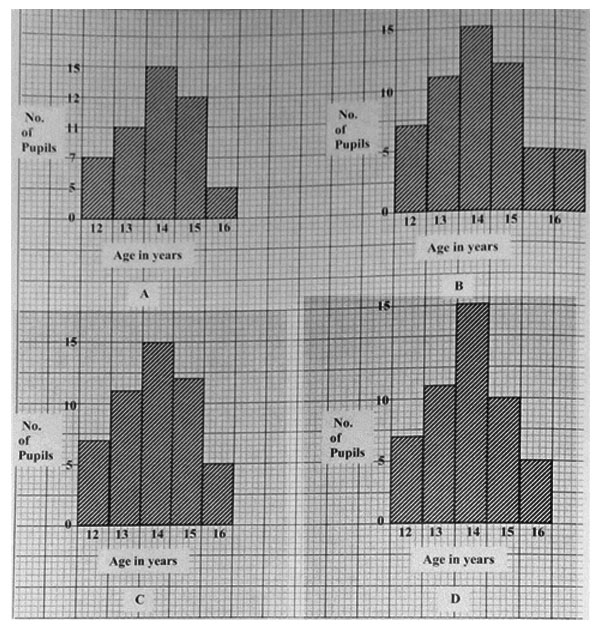
7. The table below shows the ages of 50 children.
|
Number of children |
7 |
11 |
15 |
12 |
5 |
|
Ages in years |
12 |
13 |
14 |
15 |
16 |
Which of the bar graphs correctly represents the information above?
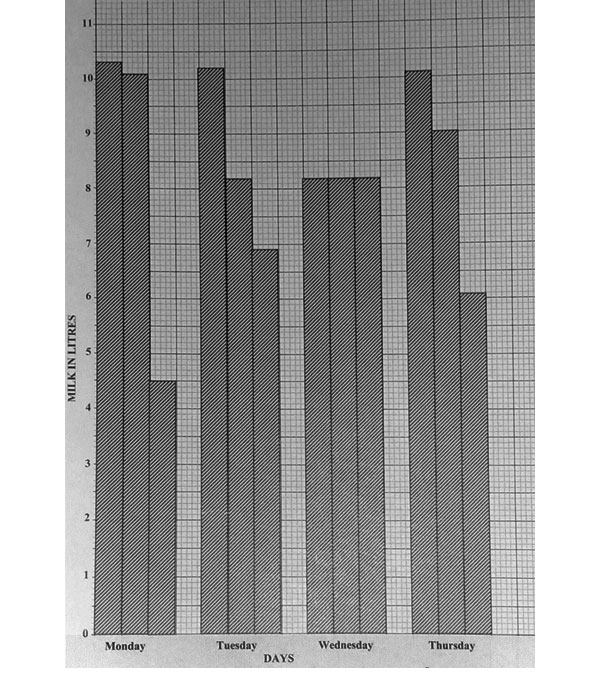
8. The bar graph below shows the number of litres of milk sold by farmers M and N in four days of a week.
If the price of milk was sh 6.20 litre, how much money did both farmers M and N receive?
A. Sh 310.00 B. Sh 210.80
C. Sh 539.40 D. Sh 520.80
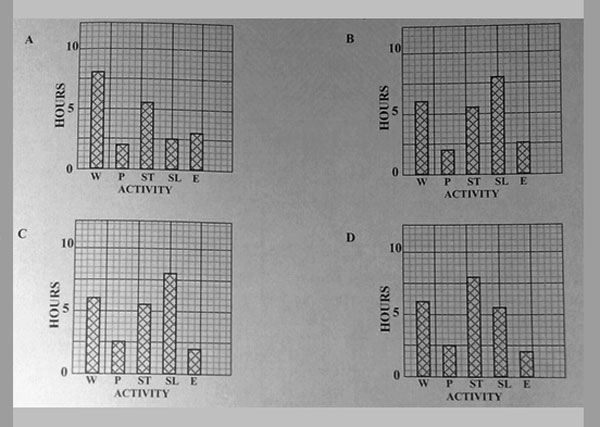
9. The table below shows how Nasimiyu spends her time.
|
ACTIVITY |
Sleeping (SL) |
Eating (E) |
Studying (ST) |
Playing (P) |
Working (W) |
|
Number of hours |
8 h |
2 h |
h |
h |
6 h |
Which of the following graphs correctly represents this information?
10. The table below shows the number of cartons of tea packed by a factory in 4 days of the week.
|
DAYS |
NO. OF CARTONS |
|
MON |
210 |
|
TUE |
330 |
|
WED |
390 |
|
THU |
300 |
The bar graph below shows the number of cartons of tea sold by the factory during the same days.
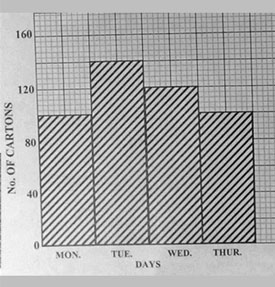
In which day of the week did the factory sell a third of the cartons packed that day?
A. MON B. TUE C. WED D. THU
11. The bar graph below shows marks scored by Njoroge in five subjects.
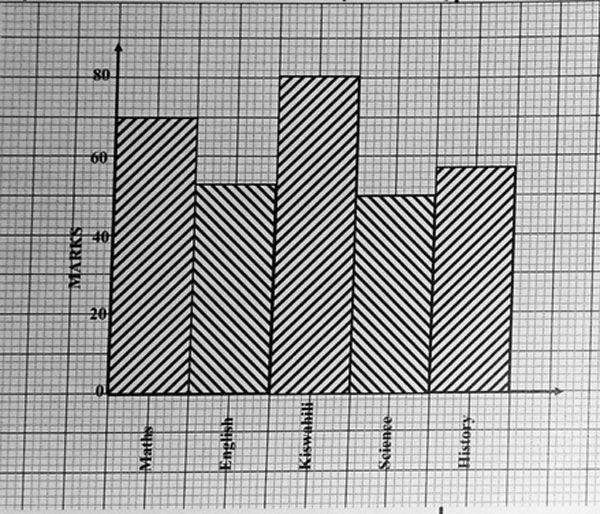
What was his mean score?
A. 55 B. 62 C. 65 D. 80
12. The bar graph below represents weekly milk delivery records in a certain dairy.
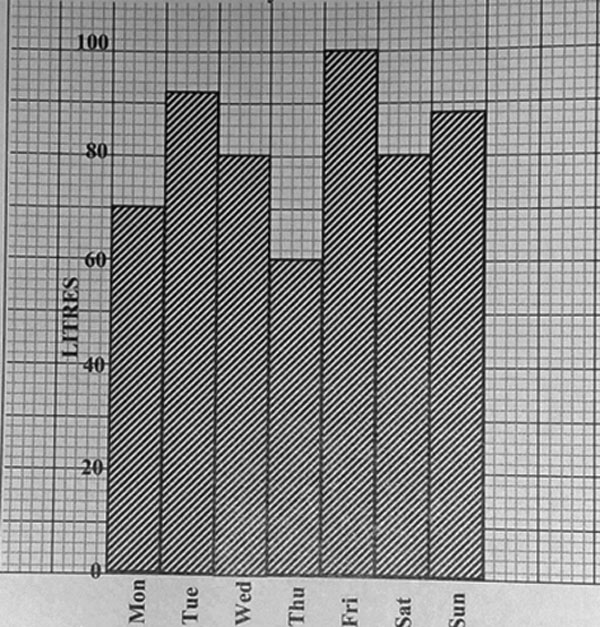
On which four consecutive days was the total amounts of milk delivered greatest?
A. Mon, Tue, Wed, Thu
B. Tue, Wed, Thu, Fri
C. Wed, Thu, Fri. Sat
D. Thu, Fri, Sat, Sun
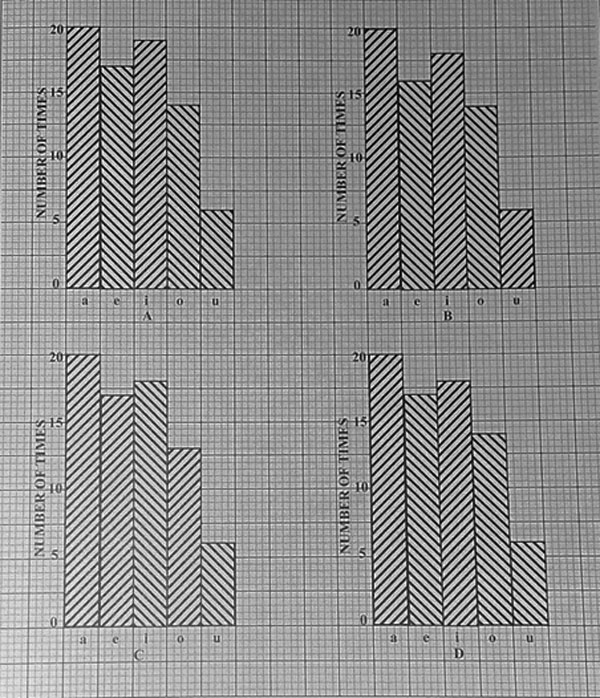
13. The number of time vowels a, e, i, o and u appears in a certain passage as shown in the table below.
|
Vowels |
a |
e |
i |
|
u |
|
Number of times |
20 |
17 |
18 |
14 |
6 |
Which of the following bar graphs correctly represents this information?
14. The bar graph below shows the sales of shoes in one week.
Which shoe size was bought most?
A. 12 B. 10 C. 8 D. 6
15. The bar graph below shows the number of pupils absent from school during one week.
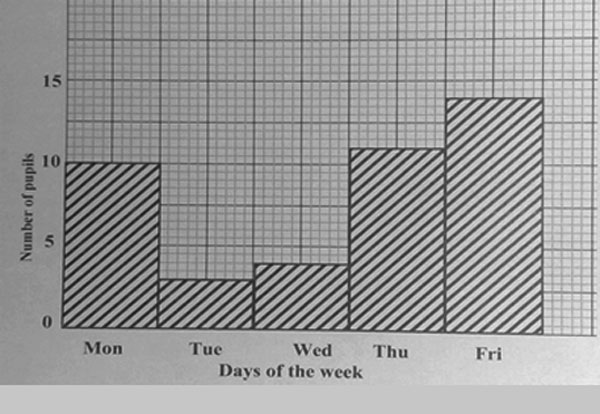
Which one of the following tables correctly represents the information in the graph?
A.
|
Days of the week |
Mon |
Tue |
Wed |
Thu |
Fri |
|
Number of pupils |
10 |
4 |
3 |
11 |
14 |
B.
|
Days of the week |
Mon |
Tue |
Wed |
Thu |
Fri |
|
Number of pupils |
10 |
3 |
4 |
12 |
14 |
C.
|
Days of the week |
Mon |
Tue |
Wed |
Thu |
Fri |
|
Number of pupils |
10 |
3 |
4 |
11 |
13 |
D.
|
Days of the week |
Mon |
Tue |
Wed |
Thu |
Fri |
|
Number of pupils |
10 |
3 |
4 |
11 |
14 |
16. The bar graphs represent the number of visitors to a game park in a Friday, a Saturday and a Sunday.
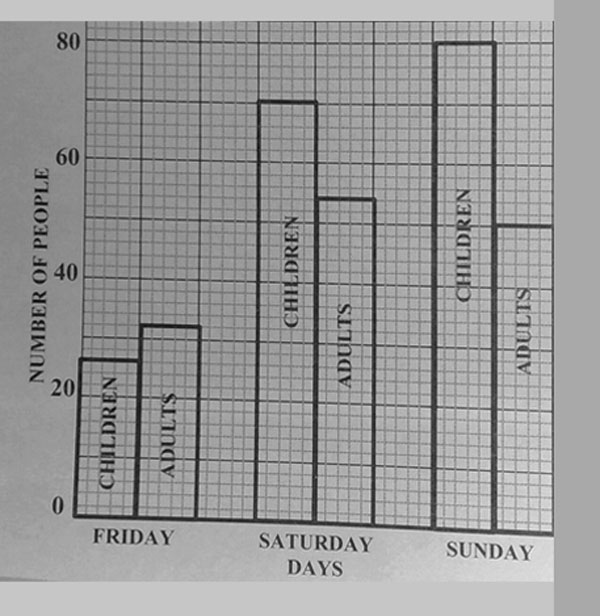
How many more children than adults visited the park during the three days?
A. 176 B. 136 C. 50 D. 40
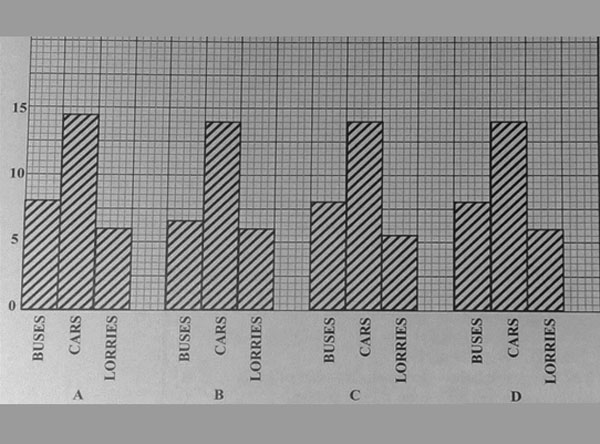
17. The information about the number of different types of vehicles near a school was recorded as follows:
|
TYPE OF VEHICLE |
BUSES |
CARS |
LORRIES
|
|
NUMBER OF VEHICLES |
8 |
14 |
6 |
Which of the following bar graphs correctly represents this information?
18. The graph below shows the number of hectares of tea for each family in a location.
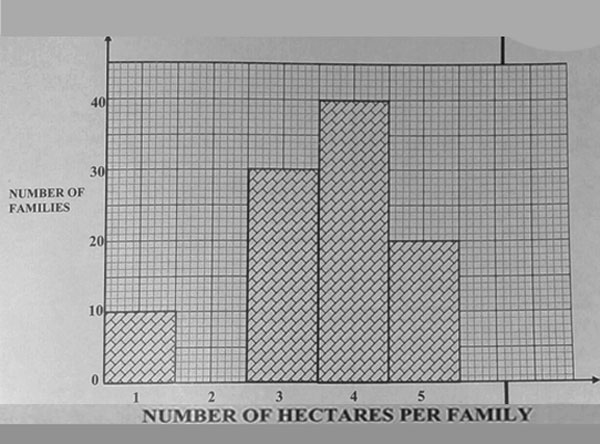
How many hectares of tea are there in the location?
A. 13
B. 40
C. 100
D. 360
1. A water tank is emptied at the rate shown in the graph below:
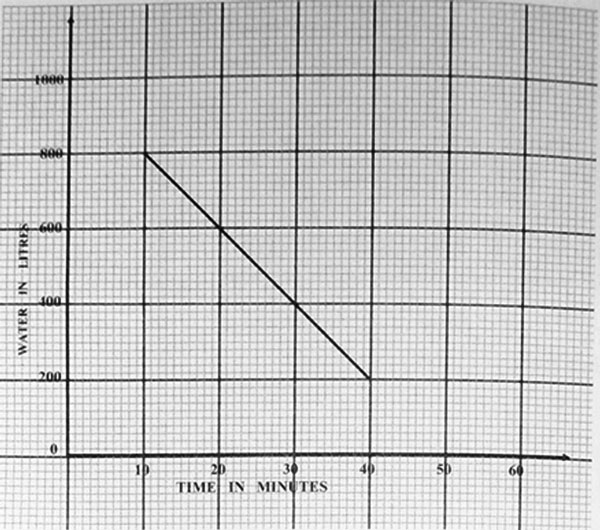
After how many minutes will the water remaining in the tank be 250 litres?
A. 20.0 B. 35.0 C. 37.5 D. 40.5
2. The graph below shows the amount of water flowing from two taps A and B at a given time. Water from both taps flow into a container at the same time.
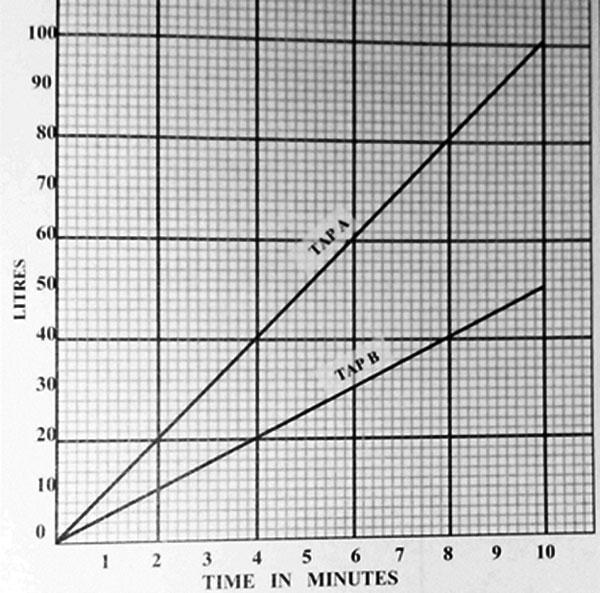
What is the total amount of water in the container at the end of 4.8 minutes?
A. 24 l B. 48 l C. 66 l D. 72 l
3. The graph below shows the cost of butter and cooking oil.
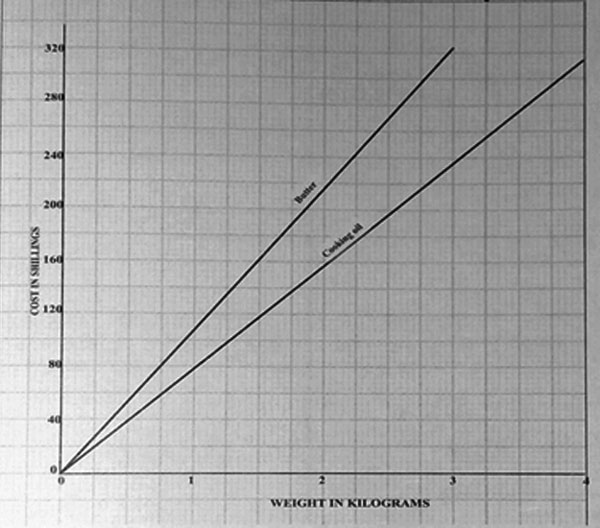
How much more is the cost of 2 3/4kg of butter than that of 2 1/4kg of cooking oil?
A. Sh 188 B. Sh 104 C. Sh 50 D. Sh 12
4. The line graph below shows the lengths of two shadows recorded at various times of the day.
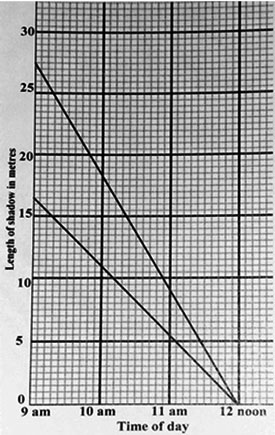
What was the difference in the lengths of the two shadows at 11:30 a.m.?
A. 7.0 m B. 4.5 m C. 2.5 m D. 2.0 m
5. The graph below shows the price of sugar. The cost of 3 kg is sh 150.
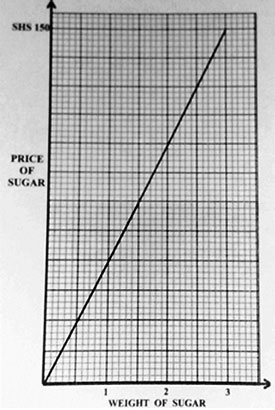
Which one of the following gives the correct vertical and horizontal scales on the graph?
| A. Vertical scale: Horizontal scale: |
1 cm represents sh 5 1 cm represents 1 kg |
| B. Vertical scale: Horizontal scale: |
1 cm represents sh 5 1 cm represents 0.5 kg |
| C. Vertical scale: Horizontal scale: |
1 cm represents sh 25 1 cm represents 1 kg |
| D. Vertical scale: Horizontal scale: |
1 cm represents sh 25 1 cm represents 0.5 kg |
1. Otieno started on a 400 kilometres journey at 7.00 a.m. He traveled at a constant speed. The graph below shows the number of kilometres remaining.
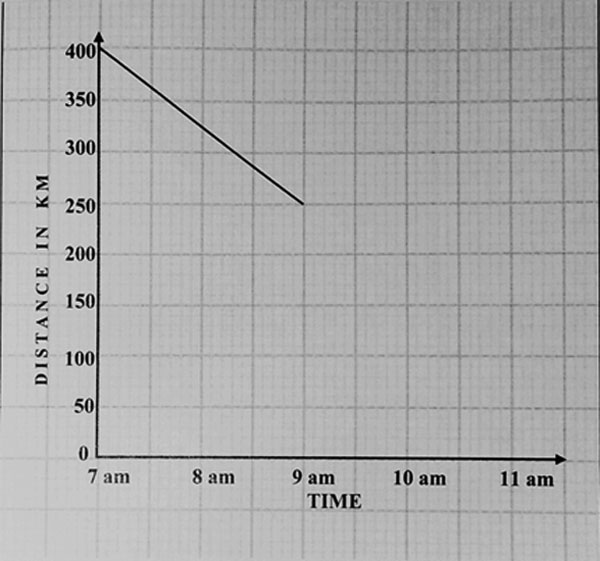
What distance of the journey remained at 11.00 a.m.?
A. 250 km B. 300 km C. 0 km D. 100 km
2. The graph shows parts of Mboga’s 70 km journey. After the one-hour rest, he continued at the same speed. At what time did he complete the journey?
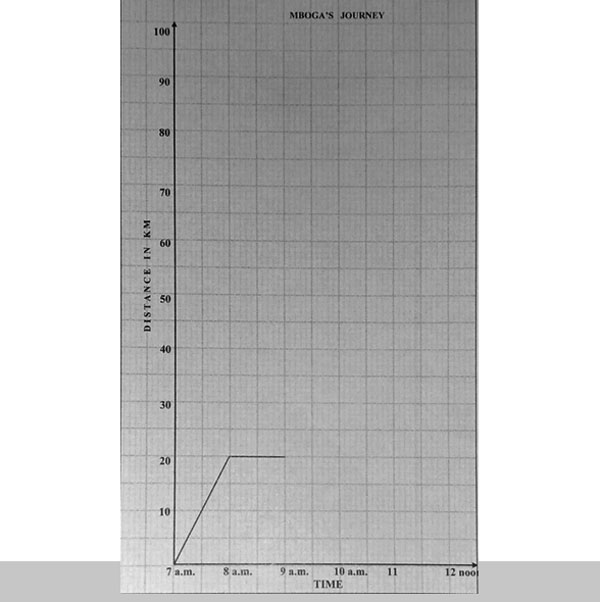
A. 9.00 a.m. B. 10.30 a.m. C. 11.30 a.m. D. 12.30 p.m.
3. The graph below shows a cyclist's journey. In which section was the speed 40 km/h?
A. PQ B. QR C. RS D. ST
4. The graph below shows Salehe’s journey from his home to Nairobi and back.
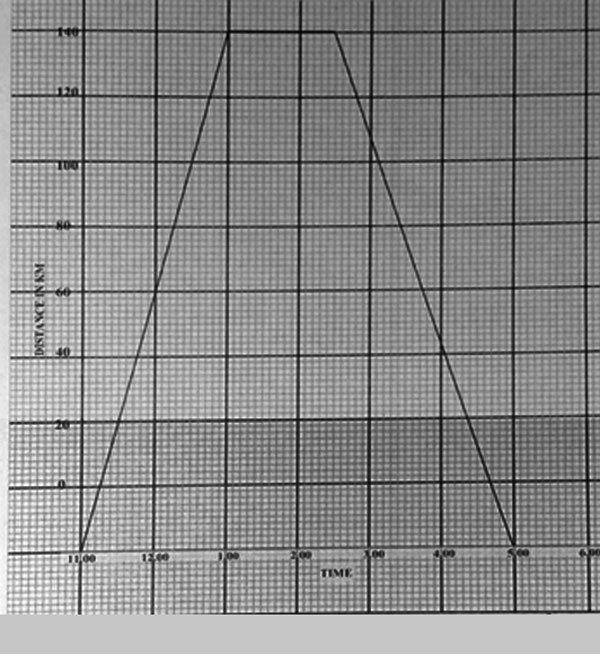
What is the average speed in kilometres per hour for the whole journey?
A. 46 2/3 B. 62 2/9 C. 23 1/3 D. 70
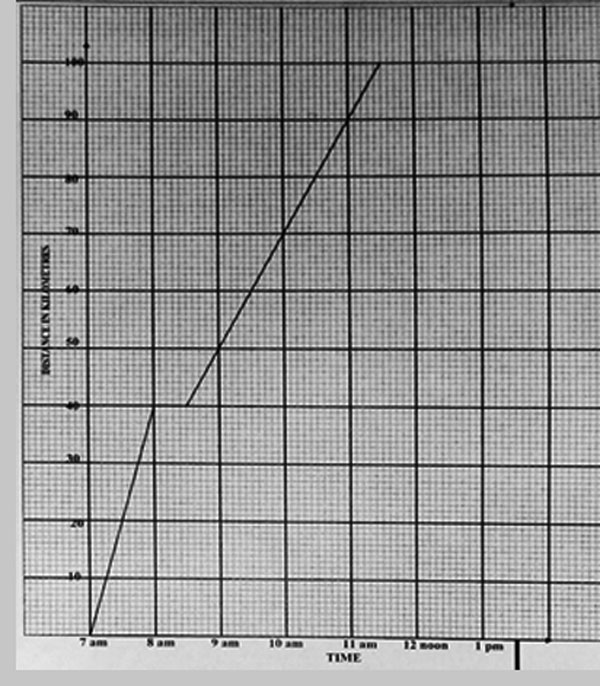
5. Wandera started his journey at 7.00 a.m. and reached the market at 10.00 a.m. The graph below shows his journey from home to the market. At the market, he rested for half an hour, then traveled back home at an average speed of 20 km/h. At what time did he reach home?
A. 11.30 a.m. B. 12.00 noon C. 12.30 p.m. D. 1.30 p.m.
6. The graph below shows a cyclist’s journey. The journey is made of sections JK, KL, LM and MN.
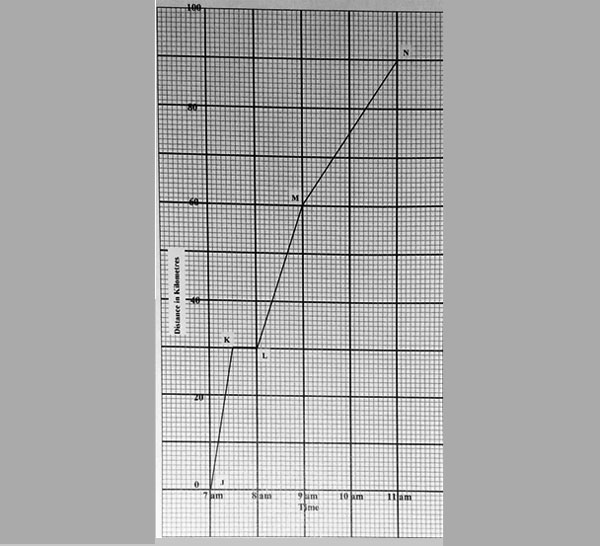
Which section represents the cyclist’s speed of 30 km/h?
A. JK B. KL C. LM D. MN
7. The graph below represents Kamau’s and Juma’s journeys.
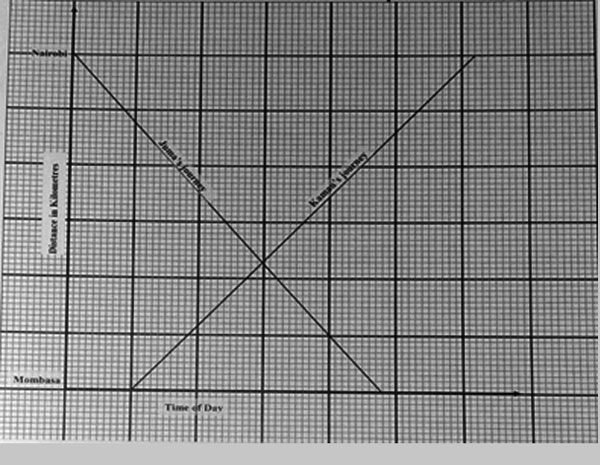
Kamau left Mombasa at 9.00 a.m. and reached Nairobi at 3.12 p.m. Which of the following statements correctly describes Juma’s journey?
A. Juma left Mombasa at 8.00 a.m. and reached Nairobi at 12.48 p.m.
B. Juma left Mombasa at 9.00 a.m. and reached Nairobi at 12.48 p.m.
C. Juma left Nairobi at 8.00 a.m. and reached Mombasa at 12.48 p.m.
D. Juma left Nairobi at 9.00 a.m. and reached Mombasa at 12.48 p.m.
8. The graph below shows part of Menya’s 90 km journey. After covering 40 km, he rested for half an hour. He then continued at a constant speed of 20 km/h.
At what time did he complete the journey?
A. 8.30 a.m. B. 9.45 a.m. C. 10.30 a.m. D. 11.00 a.m.
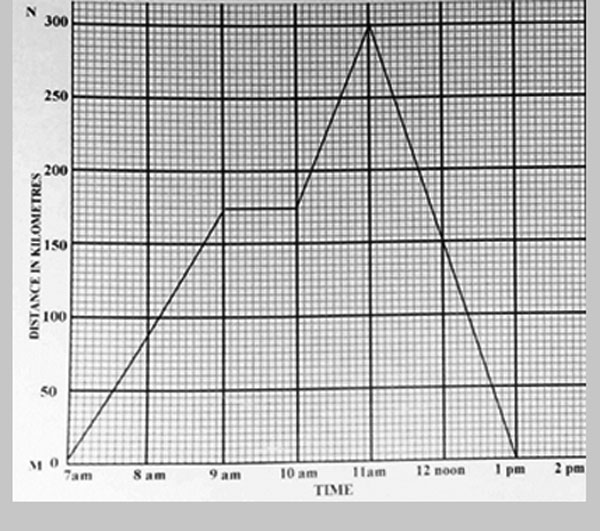
9. The graph below shows part of the journey taken by a motorist traveling from town M to town N.
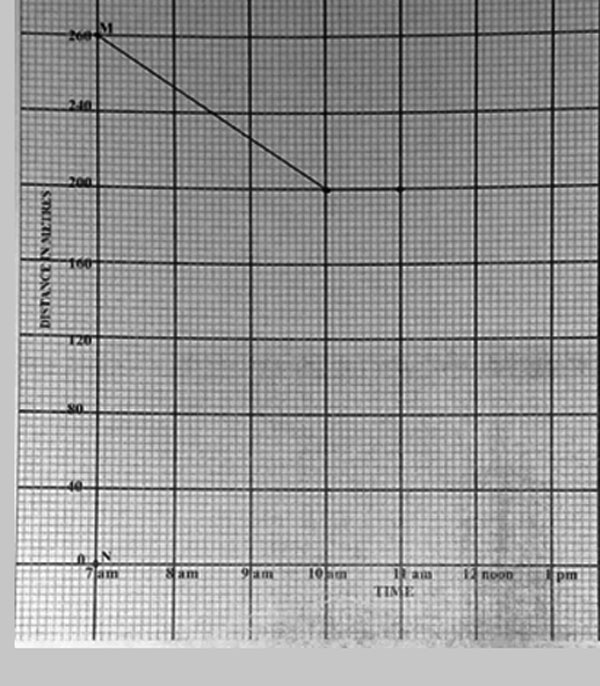
If the remaining part of the journey took 2 hours, what was the average speed for the whole journey in km/h?
A. 56 B. 40 C. 100 D. 70
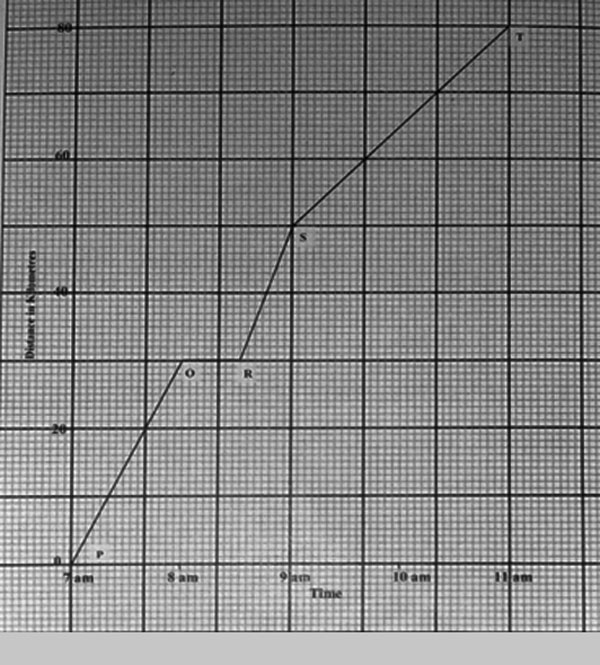
10. The graph below shows a motorist’s journey from town P to town T through towns Q, R and S.
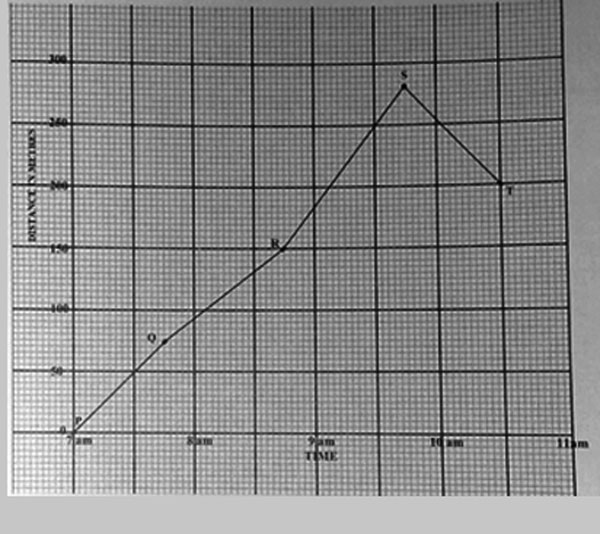
Between which two towns was he traveling at the lowest speed?
A. P and Q B. Q and R C. R and S D. S and T
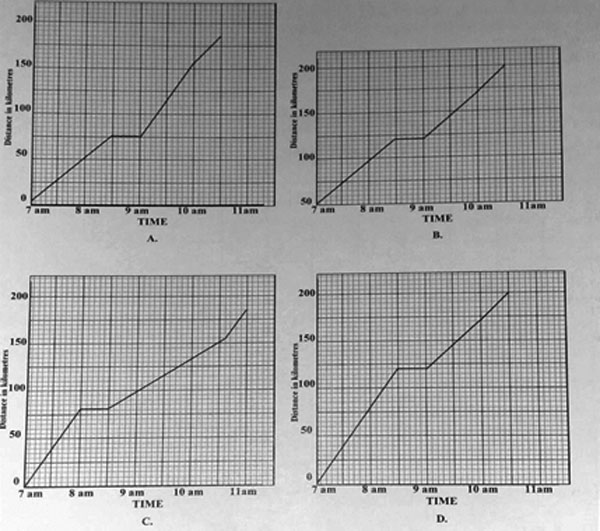
11. Ahmed left home for Nairobi at 7.00 a.m. After traveling for 1 hour and 30 minutes at the speed of 80 km/h he rested for 30 minutes. He continued the journey at the speed of 50 km/h for 1 hour and then at 60 km/h for 30 minutes to reach Nairobi. Which one of the graphs below correctly represents Ahmed’s journey?
12. The graph below shows a motorist’s journey from town M to town N and back
What was the motorist’s average speed for the whole journey?
A. 120 km/h B. 100 km/h C. 75 km/h D. 50 km/h
13. The graph below shows the journeys made by Ali and Ben.
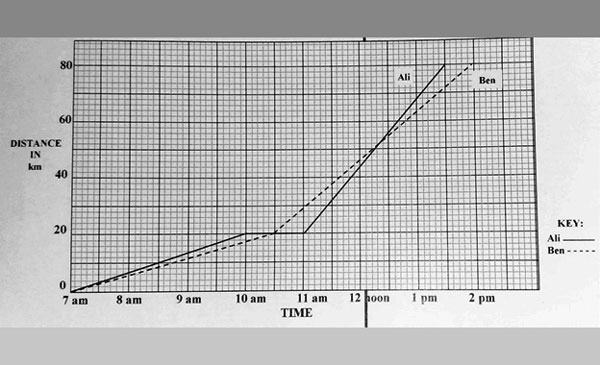
After Ben overtook Ali, how long did it take Ali to overtake Ben?
A. 4 1/4 h B. 3 1/2 h C. 2 1/2 h D. 1 3/4 h
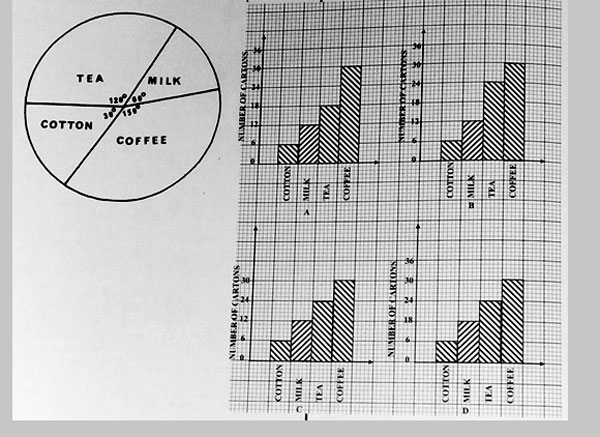
1. The pie chart below represents 72 cartons of goods in a store. Which of the bar graphs below correctly represents the same information?
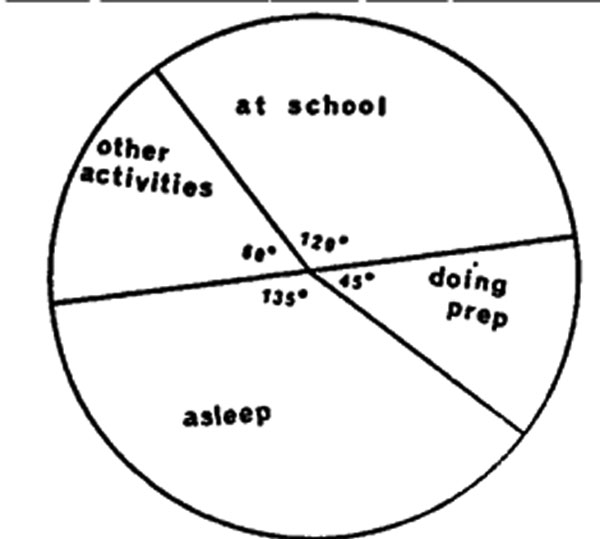
2. The pie chart below shows how Kaari spent a 24-jour day.
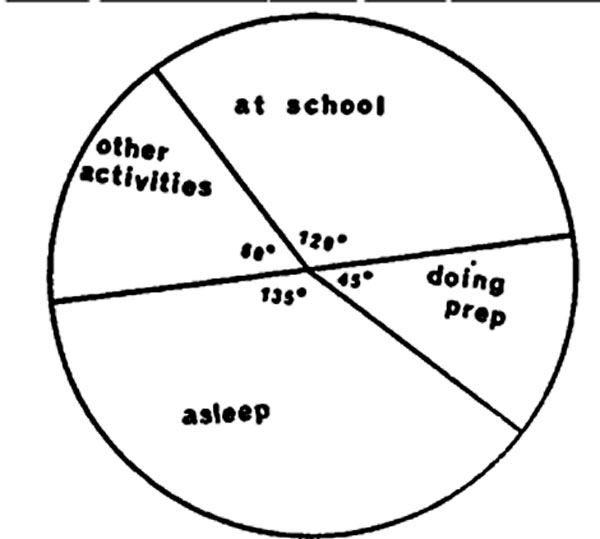
Which of the following correctly shows how she spent the 24 hours?
|
Asleep |
Doing prep |
At school |
Other activities |
| 8 |
4 |
9 |
3 |
| 9 |
4 |
8 |
3 |
| 8 |
3 |
9 |
4 |
| 9 |
3 |
8 |
4 |
3. On a market day, 12 sheep, 18 goats, 10 cows, and 20 rabbits were sold. Which one of the following sets of angles would correctly represent the number of these animals in a pie chart?
|
Sheep |
Goats |
Cows |
Rabbit |
| A. 720 |
1080 |
1200 |
600 |
| B. 1080 |
720 |
1200 |
600 |
| C. 720 |
1080 |
600 |
1200 |
| D. 1080 |
720 |
600 |
1200 |
4. Garat scored the following marks:
|
Mathematics |
8 |
|
Science |
6 |
|
English |
9 |
|
Business Education |
7 |
If these marks are represented in a pie chart, what angle would represent Science?
A. 900 B. 720 C. 2160 D. 2880
5. The pie-chart below shows how a farmer used his 18-hectare farm.
How many hectares did he use for growing maize and beans?
A. 5 B. 3 C. 9 D. 8
6. The table below shows the ages of a group of pupils.
|
Ages |
10 years old |
11 years old |
12 years old |
13 years old |
14 years old |
|
Number of pupils |
2 |
6 |
14 |
16 |
10 |
This information is to be represented in a pie chart. What angle will represent 14 years olds?
A. 900 B. 1050 C. 600 D. 750
7. The pie-chart below shows how Mulandi spent his January salary of sh 6000.
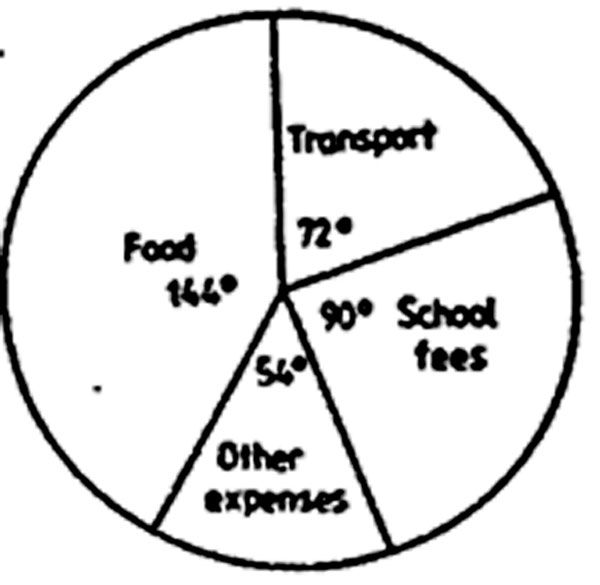
Which of the following combinations shows how he spent his salary?
|
FOOD |
TRANSPORT |
SCHOOL FEES |
OTHER EXPENSES |
|
sh |
sh |
sh |
sh |
| A. 2400 |
900 |
1500 |
1200 |
| B. 1500 |
900 |
2400 |
1200 |
| C. 900 |
2400 |
1200 |
1500 |
| D. 2400 |
1200 |
1500 |
900 |
8. Pupils in a school chose their favourite subject among Mathematics, English and Kiswahili. The information was represented on a pie chart as shown below.
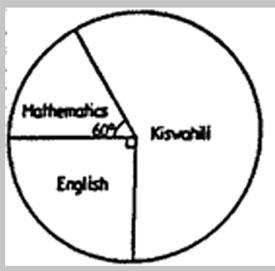
If 140 pupils chose Kiswahili, how many more pupils chose English than Mathematics?
A. 100 B. 60 C. 40 D. 20
9. The table below shows Cherop’s scores in an examination.
|
Subject |
English |
Maths |
GHC |
Science |
|
Score out of 10 |
8 |
5 |
7 |
4 |
If a pie chart were to be drawn, what would be the size of the angle representing GHC?
A. 1050
B. 2520
C. 630
D. 52.50
10. The pie-chart below shows the number of animals in a farm. There are 5 donkeys in the farm.
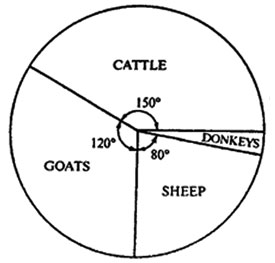
What is the total number of sheep and goats in the farm?
A. 40 B. 60 C. 100 D. 200

