A map is a representation of the earth or part of the earth on a flat surface or globe.
Parts of the earth can be a school, village, district, province, a country or a continent. Features like hills, valleys, rivers, and lakes can also be represented on a map.
A map is different from a picture.

A picture shows things as they are on the ground.
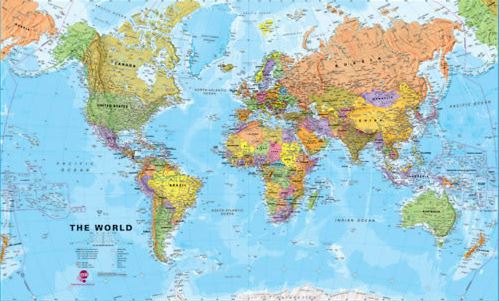
Some maps show a very large area, like this map of the entire Earth;
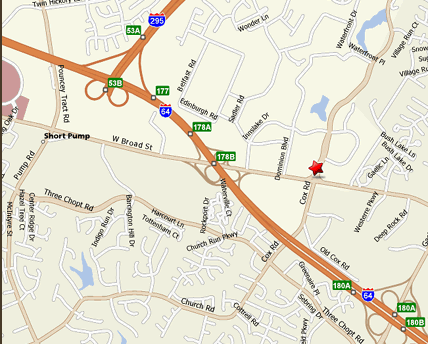
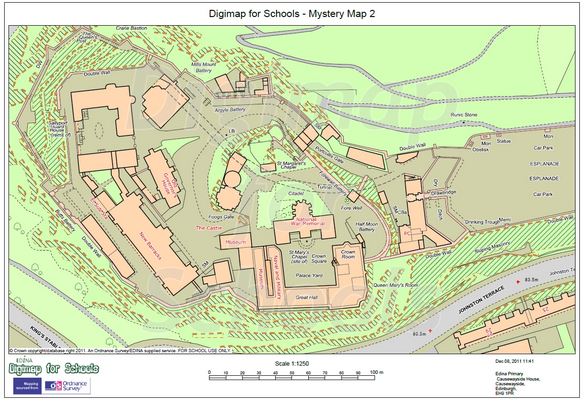
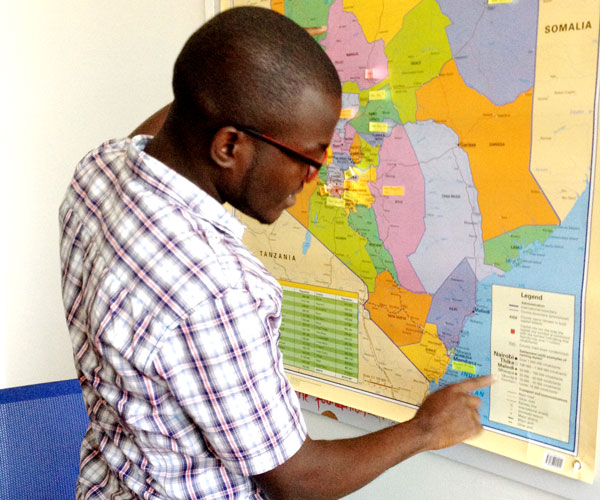
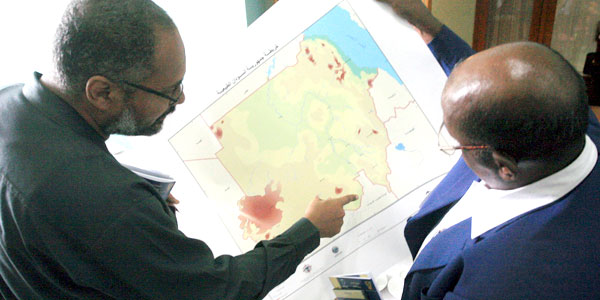
And other maps show very small areas, like in this example;
Elements of a map are also called marginal information. Marginal information is the additional information used to explain symbols found on a map.
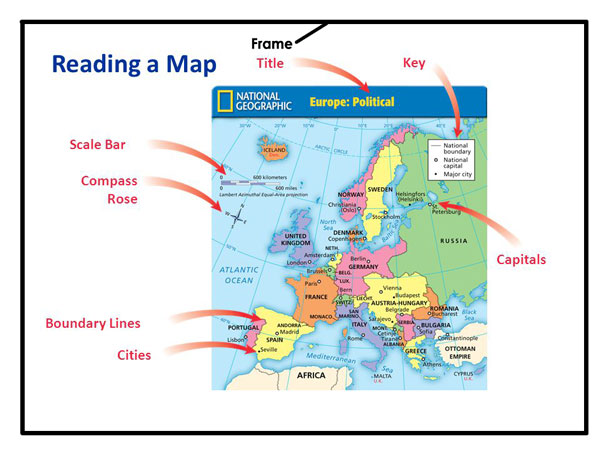

Title, key, frame, scale, and compass direction are used to read and interpret a map.
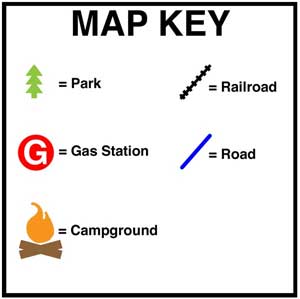
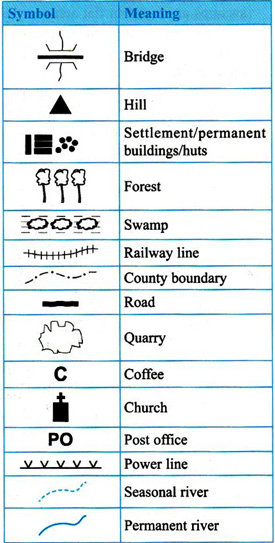
The key is used in reading and interpreting a map. It contains symbols of features represented on a map and their meanings. We, therefore, need to study the key carefully when reading or interpreting a map.
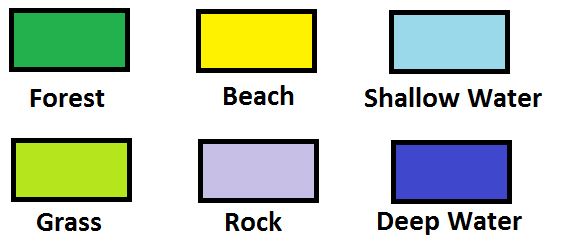
Different colours are used on maps to represent different features. The image below gives some examples of what different colours may represent on a map.
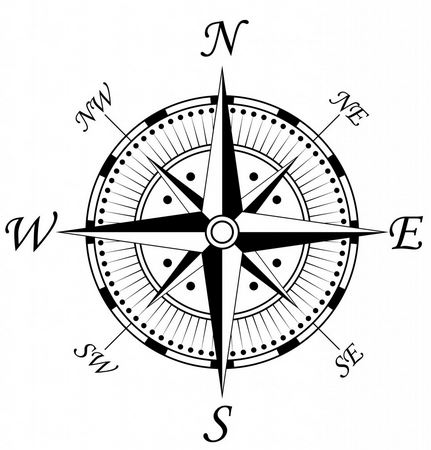
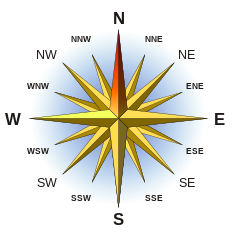
Direction of places on a map can be shown using a compass. A compass is always drawn on the map. The North direction is always shown on the compass from which other directions are identified.
The four main points of a compass are called cardinal points - East, West, North and South. Cardinal points are divided into eight points of a compass, which is also subdivided into sixteen points of a compass as shown below.
Every map has a key in which all the symbols used on it are explained. Symbols vary from one map to another. We, therefore, must study the key carefully. Below is a simple example of a key.
Using symbols, one can describe different relief features found on maps. By studying the key, one can also describe the general relief of an area.
i) The presence of many hills in an area being represented shows that the area is hilly. The highest point on the map can be obtained by studying the height of hills shown on the map.
ii) The presence of swamps may indicate that the area is generally flat. We should not assume that all swamps are found in lowland areas. Some swamps are found in flat areas in the highlands. By using the direction of flow of rivers, we can tell to which direction the land is sloping.
iii) Crops can indicate whether a place is within highland or lowland areas. For example, sugar cane and cotton grow in lowland areas where the climate is generally hot. Tea, coffee and pyrethrum are mainly grown in highland areas.
iv) The presence of forests may indicate that a place is a highland area. However, this is not always the case as some forests are found in lowland areas along the Coast,where rainfall is high and temperature is high.
v) The presence of volcanic soil may show that the area is a highland.
vi) Lakes and oceans are found in lowland areas.
Vegetation features are often shown using green colour on maps.
i) As we have seen, the presence of forests may be used to indicate that a place receives high rainfall. Since most of forests are found on highlands, they may show that the area experiences low temperatures.
ii) The presence of scrub or grassland may indicate that the area receives low rainfall.
iii) Lack of agricultural activities may indicate that the climate or soil is not good for crop farming.
iv) Very low population may be a sign that climate, soils or land surface are unsuitable for crop farming or for building homes.
Drainage refers to water features and how they are distributed. They include oceans, seas, oases, rivers, swamps, waterholes, boreholes,lakes, dams and springs. On maps, they are represented using different shades of blue.
i) Presence of many rivers especially if they originate from one particular area may indicate that the area receives high rainfall.
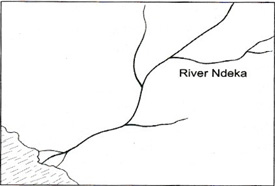
ii) The direction of tributaries as they join the main river can be used to identify the main direction of flow of the river.
iii) Presence of boreholes and oases shows that the area receives little rainfall.
iv) Drainage system is also used to show relief of the land.
By studying the various symbols shown on the map, it is possible to tell peoples' economic activities. Some examples are shown below:
1. Trade - Towns, shops, markets.
2. Transport and communication - All-weather roads, railways, airports and airstrips, dry weather roads, ports, post office, telephone lines,
3. Industry - Factory, mills, industrial plants, power stations
4. Crop farming - Plantations and farms, flour mills, irrigation channels, processing factory for a plant product
5. Livestock farming - Cattle dips, ranches, creameries, slaughter houses,
6. Mining - mineral works, quarries, mines,
7. Fishing - Fish traps, fishing villages, fish processing plant, fish ponds,
N/B The presence of rivers or lakes may not necessarily mean that fishing takes place.
8. Tourism - Museums, historical sites, game reserves, game parks, animal orphanages, hotels and beaches.
9. Forestry - Saw mills
10. Religion - Mosque, church, temple, shrine
11. Medical - Dispensary, hospital, health centre, clinic
12. Education - Schools
On most maps, settlements are shown using dots of different shapes and sizes. For example:
1. Small round dots indicate huts while small squares indicate permanent buildings.
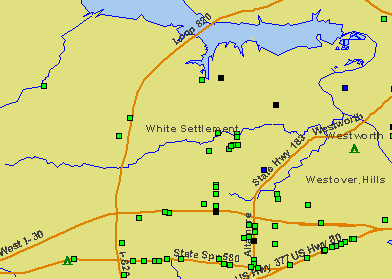
2. Areas with low population or settlement tend to have few dots scattered all over the map. Areas with crowded settlements will be indicated by the presence of many dots clustered together.
3. By studying the arrangement of dots, we can tell the type of settlement patterns in an area.
4. Areas with low population distribution show that the areas may be experiencing low rainfall or the areas may be having infertile soils.
The direction of places on a map can be shown using a compass. A compass is always drawn on the map. The North direction is always shown on the compass from which other directions are identified.
The four main points of a compass are called cardinal points.
Cardinal points include; East, West, North, and South. Cardinal points are divided into eight points of a compass, which is also subdivided into sixteen points of a compass.
Distance on a map can either be straight or curved. Distance on a straight line can be measured using;
1. A ruler
2. A straight edge of a paper
3. A pair of dividers
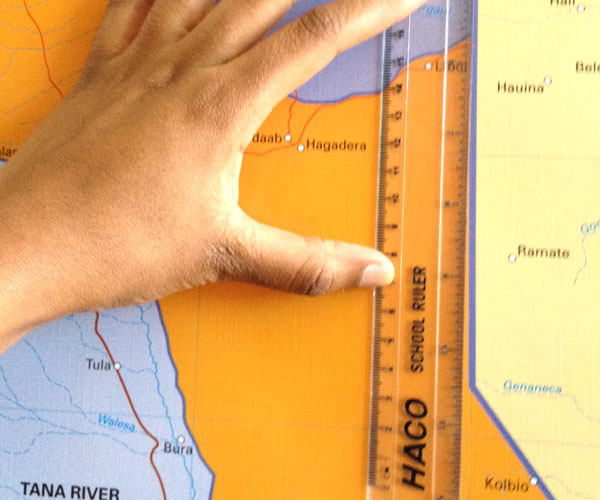
To find the distance between two points using a ruler, place the ruler along the line. Read the measurement on the ruler then place the ruler along the linear scale to read the actual distance.
To measure the distance between points T and U in Fig. 1.6 below using a pair of dividers, follow the following steps:
If the distance to be measured is longer than the dividers can measure, then a shorter distance can be measured a number of times.
This is done by setting the divider at a shorter distance, and then rotating it until the whole distance is covered.
This can be done using the following;
1. A piece of thread
2. A sheet of paper
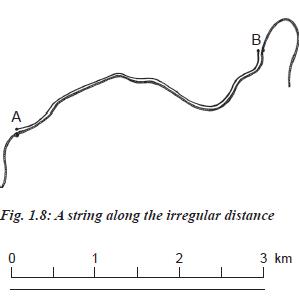
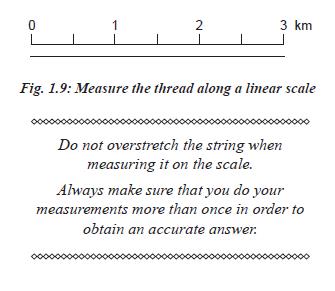
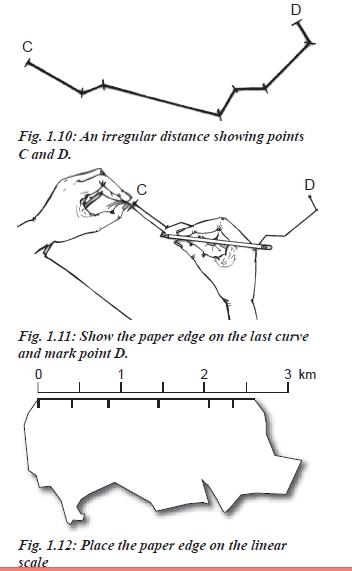
To measure an irregular distance between points A and B using a piece of thread, carefully lay the thread along the line as shown below.
A piece of paper can be used to measure the length of an irregular distance along a road, railway or river. This is done in the following way;
The diagrams below show how to measure irregular distance using a sheet of paper, systematically.
Shapes of surfaces on a map can either be regular or irregular. Below is how to calculate the area of regular and irregular shapes.
To calculate the area of regular shapes like rectangles, squares or right-angled triangles, we apply the formula used in mathematics. The scale should be used in working out the length and width before they are multiplied. The answer is given in square kilometers.
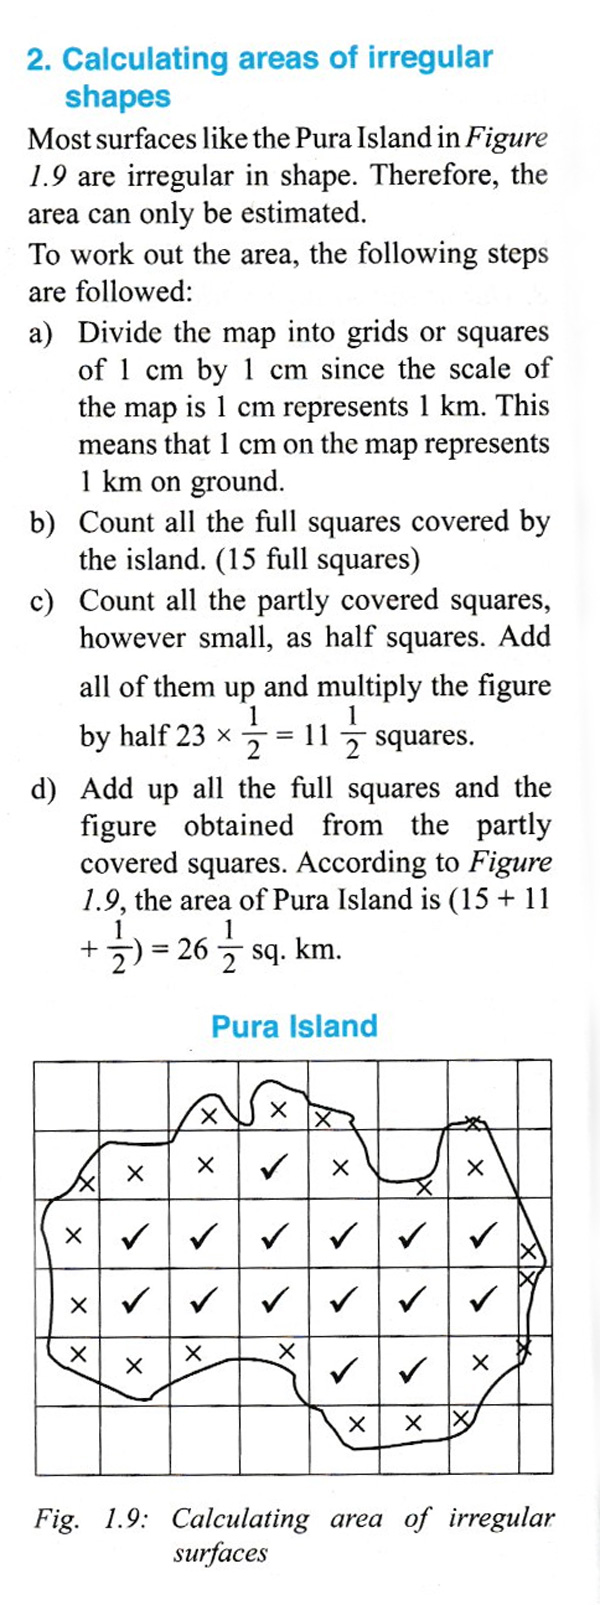
Most areas of surfaces like the island in Fig. 1.13 (shown on the next page) are irregular in shape. Therefore, the area can only be estimated.
To work out the area, the following steps are followed:
1. Divide the map into grids or squares of 1 cm by 1 cm since the scale of the map is 1 cm represents 1 km; this means that each square on the map represents 1 square km on land.
2. Count all the full squares covered by the island. (15 full squares)
3. Count all the partly covered squares, however small, as half squares. Add all of them up and multiply the figure by half 23 x 1/2 = 11 1/2 sq.km
4. Add up all the full squares and the figure obtained from the part squares. According to Fig. 1.13, the area of the island is 15 + 11 + 1/2 = 26 1/2 sq. km.
A diagram of an irregular map is shown below, indicating the full and partly covered squares which are shaded differently.
Watch this video
